|
Continued from
FrontPage
of Article
Annex A
ANNUAL SURVEY ON INFOCOMM USAGE IN HOUSEHOLDS AND BY
INDIVIDUALS FOR 2005
EXECUTIVE SUMMARY
Introduction
The Annual Survey on Infocomm Usage in Households and
by Individuals for 2005 is the tenth edition in an annual series
that began in the 90’s.
The survey aims to gauge the adoption and extent of
usage of infocomm appliances/services in households and among
individuals.
Comparisons with previous years’ survey findings are
provided where available and appropriate.
Research Methodology
The sample was selected from the Household Sampling
Frame maintained by the Department of Statistics (DOS). Selection
was done using a two-stage stratified design.
The survey comprised 2 sets of questionnaires:
-
The household questionnaire which was answered by a
family member aged 15 years and above who is in the position to
answer the questions for the whole family. The household
questionnaire was directed at all households, regardless of
nationality.
-
The individual questionnaire which was answered by
one randomly selected family member aged 15 years and above. The
individual questionnaire was directed only at the resident
population.
Fieldwork for the survey was carried out from
November 2005 and ended in the middle of January 2006. A total of
2,000 households and 2,000 individuals were interviewed.
Access to a Computer at
Home
The
proportion of households with access to a computer at home was 74%
(Figure 1). This proportion has remained unchanged since 2003.
Figure 1: Households with Access to a Computer at Home
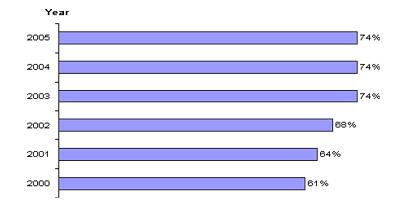
Base: Total households.
The proportion of households with two or more
computers was 28% (Figure 2).
Figure 2: Number of Computers in Households
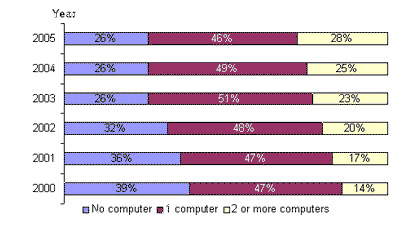
Base: Total
households.
Nine in
ten households in private housing had access to a computer at home;
compared to seven in ten households in public housing (Figure 3).
Figure 3: Households with Access to a Computer at Home

Base: All households in
private or public housing respectively.
“No
necessity” (35%) and “Lack of skills” (32%) were the top two main
reasons cited for not having access to a computer at home (Table 1).
Table 1: Single Main Reason for Not Having Access to a Computer at
Home
|
|
2004 |
2005 |
|
No necessity |
42% |
35% |
|
Lack of skills |
19% |
32% |
|
PC costs are too high |
16% |
15% |
|
Age is a barrier |
9% |
12% |
|
Children too young |
3% |
6% |
|
Have access elsewhere |
9% |
0% |
|
Others |
2% |
0% |
|
Total |
100% |
100% |
Base: Total households without access to a computer at home.
Internet Access at
Home
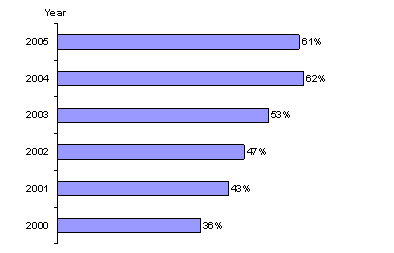
The
proportion of households with access to the Internet at home was 66%
(Figure 4).
Figure 4: Households with Access to the Internet at Home

Base: Total
households.
Nine in
ten households in private housing had access to the Internet at home
compared to about six in ten households for public housing (Figure
5).
Figure 5: Households with Access to the Internet at Home

Base: All households
in private or public housing respectively.
Access
costs are too high” (29%) was the top main reason cited for not
having Internet access at home (Table 2).
Table 2: Single Main Reason for Not Having Internet Access at home
|
|
2004 |
2005 |
|
Access costs are too high |
18% |
29% |
|
Have access elsewhere |
29% |
17% |
|
No necessity |
24% |
16% |
|
Lack of interest |
0% |
11% |
|
Concern about exposure to inappropriate/harmful content |
3% |
10% |
|
Others |
4% |
9% |
|
Lack of skills |
11% |
6% |
|
Privacy concern |
2% |
1% |
|
Security concern |
0% |
1% |
|
Children are too young |
6% |
0% |
|
No time |
3% |
0% |
|
Total |
100% |
100% |
Base: Total households with access to a computer at home but without
Internet access.
Infocomm Appliances/Services
About
two-thirds of the Singapore’s resident population aged 15 years and
above were computer users (Figure 6).
Figure 6: Computer Users

Base: Total resident population aged 15 years and above.
61% of
Singapore’s resident population aged 15 years and above were
Internet users (Figure 7).
Figure 7: Internet Users
Base: Total resident population aged 15 years and above.
Infocomm Appliances/Services
Nearly
all Internet users (96%) used the Internet in the last 12 months as
a communication tool (Table 3).
Table 3: Usage of Internet Applications/Services in 2005
|
|
Ever Used |
Used in the last 12 months |
|
For communicating: |
96% |
96% |
|
Sending or receiving emails |
94% |
90% |
|
Other communication tools (e.g. chat rooms/sites and instant
messaging) |
45% |
43% |
|
Blogging |
18% |
17% |
|
Peer-to-peer |
12% |
11% |
|
Telephoning over the Internet (VoIP) |
9% |
7% |
|
|
|
|
|
For getting information: |
89% |
86% |
|
General web browsing |
74% |
71% |
|
Information on goods or services |
59% |
57% |
|
Information from government organisations/public authorities
(from web sites or via email) |
54% |
52% |
|
Information related to health or health services |
34% |
32% |
|
Information on job opportunities |
33% |
29% |
|
|
|
|
|
For leisure activities: |
63% |
61% |
|
Playing or downloading computer/video games |
39% |
37% |
|
Downloading or uploading other media (e.g. digital photos) |
38% |
36% |
|
Downloading or listening to online music |
30% |
28% |
|
Reading or downloading electronic books, newspapers or
magazines |
28% |
26% |
|
Downloading or watching movies, short films or images |
24% |
23% |
|
Downloading or watching movies, short films or images |
24% |
23% |
|
Listening to web radio or watching web television |
15% |
14% |
|
|
|
|
|
For dealing with government organisations/public authorities: |
59% |
57% |
|
Completing or lodging forms online (e.g. income tax filling) |
47% |
46% |
|
Downloading or requesting forms |
44% |
42% |
|
Making online payments |
29% |
28% |
|
|
|
|
|
For transacting: |
43% |
43% |
|
Internet banking |
32% |
29% |
|
Applying for jobs |
22% |
19% |
|
Selling goods or services (e.g. through auction sites) |
10% |
9% |
|
|
|
|
|
For other activities: |
35% |
32% |
|
Downloading software, patches or upgrades |
24% |
22% |
|
Formal education or training activities (e.g. e-learning) |
21% |
19% |
|
|
|
|
|
For remote access: |
29% |
28% |
|
Access documents/ applications/ collaborative tools from
office server outside office (for office work) |
19% |
18% |
|
Access documents/ applications/ collaborative tools from
school server outside school (for school work) |
14% |
12% |
|
Home business |
3% |
2% |
Base: Total Internet users aged 15 years and above.
Online Shopping
27% of
Internet users ever made purchases online (Figure 8). Each online
shopper spent an average amount of S$1,068 on Internet purchases in
the last 12 months. The most popular products/services bought
online in the last 12 months (Table 4) were travel products; and
clothing, footwear, sporting goods or accessories.
Figure 8: Online Shopping
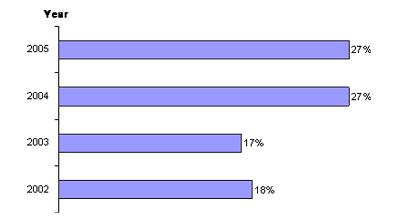
Base: Total Internet users aged 15 years and above.
Table 4: Products/Services Bought Online
|
|
Ever bought |
Bought in the last 12 months |
|
Travel products (air tickets, accommodation, vehicle hire) |
30% |
28% |
|
Clothing, footwear, sporting goods or accessories |
27% |
26% |
|
Tickets or booking for entertainment events (sports, theatre,
concerts) |
20% |
19% |
|
Computer equipment or parts (including peripheral equipment) |
14% |
12% |
|
Entertainment (music, video) |
13% |
12% |
|
Financial products (including shares and insurance) |
10% |
8% |
|
Food, groceries, alcohol or tobacco |
8% |
6% |
|
Information technology and telecommunications services
(excluding software) e.g. subscription of ICT services such as
Internet access, cable TV |
7% |
6% |
|
Photographic, telecommunications or optical equipment |
3% |
3% |
Base: Total Internet users aged 15 years and above who had ever
purchased online.
“Lack of
interest” (34%) and “Preference to shop personally” (32%) were the
two main barriers to online shopping (Table 5).
Table 5: Single Main Reason for Not Buying Online
|
|
2004 |
2005 |
|
Lack of interest |
17% |
34% |
|
Preference to shop personally |
40% |
32% |
|
Security concerns |
25% |
14% |
|
Trust concerns e.g. worried about warranties, receiving goods
or services and/or returning goods |
0% |
7% |
|
Privacy concerns e.g. worried about giving personal details |
0% |
6% |
|
Others |
4% |
5% |
|
Lack of skills |
2% |
2% |
|
No credit card |
8% |
0% |
|
Lack of information provided to reach a purchase decision |
4% |
0% |
|
Total |
100% |
100% |
Base: Total Internet users aged 15 years and above who had never
purchased online.
Home Internet Security
More
than half (54%) of the home Internet users aged 15 and above ever
experienced a virus attack (Figure 9). About eight in ten (81%)
home Internet users aged 15 and above protect their computer with
virus checking software (Figure 10). However, fewer Internet users
installed anti-spyware software (56%) or firewall (53%).
Figure 9: Experiences with Virus Attack
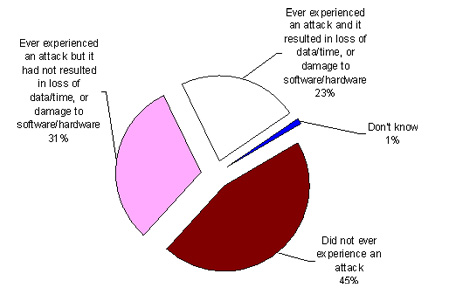
Base: Total home Internet users aged 15 years and above.
Figure 10: Usage of Internet Security Software
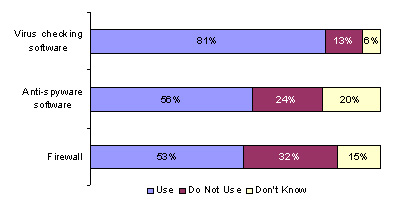
Base: Total home Internet users aged 15 years and above.
Source:
www.ida.gov.sg Media Release 28
Feb 2006 |


