|
 |
|
Source:
www.singstat.gov.sg |
|
ECONOMIC SURVEYS SERIES
Reference Year 2005 |
|
FOOD & BEVERAGE SERVICES |
|
|
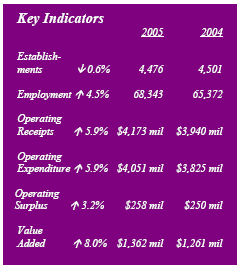
In 2005, the food & beverage (F&B) services
industry comprised about 4,500 establishments. The industry employed
some 68,300 workers, or about 15 workers per establishment. |
|
I. ECONOMIC PERFORMANCE |
|
Total operating receipts
collected by the F&B services industry was $4,173 million in 2005,
an increase of 5.9 per cent over 2004. On a per establishment
basis, operating receipts increased from $875,400 to $932,300 over
the same period. |
|
Total operating expenditure
incurred by F&B services industry went up by 5.9 per cent to
$4,051 million in 2005. Likewise, operating expenditure per
establishment increased from $849,700 in 2004 to $905,100 in 2005. |
|
Total operating surplus
stood at $258 million in 2005, an increase of 3.2 per cent
compared to the previous year. Operating surplus per establishment
rose by 3.8 per cent to $57,700 in 2005. |
|
Total value added
generated by F&B services industry was $1,362 million in 2005, an
increase of 8.0 per cent over 2004. On a per establishment basis,
value added increased from $280,300 in 2004 to $304,300 in 2005. |
|
II. MAIN TYPES OF FOOD & BEVERAGE
SERVICES |
|
Restaurants constituted the largest
group, accounting for 28.1 per cent of the total establishments in
F&B services in 2005. They employed about 26,600 workers or 38.9
per cent of the total workforce in the industry (Chart 1). |
|
 |
|
On a per establishment basis, however,
fast food outlets were the largest employers, engaging an average
of 37 workers, of which a large proportion were part-time workers.
Restaurants and food caterers engaged an average of 21 and 26
employees per establishment respectively. |
|
Restaurants constituted the most
important group in terms of total operating receipts and total
value added, contributing 37.3 per cent and 41.9 per cent
respectively. Although small in number, food caterers’
contributions to total operating receipts (13.3 per cent) and
total value added (17.3 per cent) of the F&B services industry
were also fairly significant (Chart 2). |
|
 |
|
Purchases of food and beverages for
sale, remuneration and rental of premises were the top three
business cost items for overall F&B services in 2005 (Table 1).
For restaurants and food caterers, about twothirds of total
operating expenditure was incurred on food and beverages for sale
and remuneration. |
|
Rental expense was the second largest
cost item for fast food outlets, accounting for 24.9 per cent of
total operating expenditure. In contrast, rental accounted for
only 4.5 per cent of total operating expenditure for food
caterers. |
|
 |
|
III. KEY PERFORMANCE RATIOS |
|
Profitability Ratio
of overall F&B services declined marginally to 6.2 per cent in
2005 from 6.4 per cent in 2004. Among F&B services, food caterers
achieved the highest profitability ratio of 17.5 per cent in 2005
(Chart 3), compared to the 4.0 per cent and 5.2 per cent
profitability ratio for restaurants and fast food outlets
respectively. |
|
 |
|
Earning-expenditure Ratio
for overall F&B services dropped marginally from 6.5 per cent in
2004 to 6.4 per cent in 2005. Food caterers were the most
cost-effective, registering an earnings-expenditure ratio of 20.3
per cent in 2005 (Chart 4). |
|
 |
|
Average Annual Remuneration
per Employee for overall F&B services
was $16,300 in 2005, an increase of 4.5 per cent over 2004.
Employees in food catering services received the highest
remuneration at $28,600 in 2005 (Table 2). Average remuneration
was much lower at $10,300 for fast food outlets, which employed a
large number of part-timers. |
|
 |
|
Value Added per Worker
was $19,900 for the overall F&B services in 2005, increasing by
3.1 per cent over 2004. Within the industry, food catering
services recorded the highest labour productivity of $47,700,
compared to value added per worker at $12,900 to $21,400 in the
other three groups (Chart 5). |
|
 |
|
IV. PERFORMANCE BY FIRM SIZE |
|
Small and medium firms (ie less than
100 workers) comprised the majority (99.1 per cent) in the F&B
services industry (Table 3). They contributed 79.2 per cent of
operating receipts of the industry. However, large firms (100
workers & above) registered a profitability ratio at 12.8 per
cent, much higher than the smaller firms’ profitability ratio. |
|
 |
|
More..... |
|
Source:
www.singstat.gov.sg Media
Release 5 Apr 2007 |
|
 |
|
Important
Notice |
|
Our FrontPage
Editions are a historical record of our Web site and reflect
the changing of the times, and also of our Web site through
time. We do not and will not update the links and stories on
these FrontPages even if they have become obsolete. |
|


