|
|
|
The retail trade industry comprised about
20,000 establishments in 2005. The workforce of the industry expanded by
8.1 per cent to a total of 105,400 workers in 2005. |
|
I. ECONOMIC PERFORMANCE |
|
Total operating receipts
of the retail trade industry amounted to $36.2 billion in 2005, a
significant increase of 11.8 per cent over 2004. Similarly, operating
receipts per establishment rose from $1.6 million in 2004 to $1.8
million in 2005. |
|
Total operating
expenditure incurred by the industry stood at
$34.5 billion in 2005, representing a significant increase of 11.6 per
cent compared to 2004. Similarly, operating expenditure per
establishment grew sharply by 12.7 per cent to $1.7 million in 2005. |
|
Total operating surplus
rose from $1.7 billion in 2004 to $1.9 billion in 2005, arising from the
higher industry turnover. On a per establishment basis, operating
surplus also increased by 15.3 per cent to $97,700 in 2005. |
|
Total value added
generated by the retail trade industry was $4.2 billion in 2005, 13.6
per cent higher than the $3.7 billion recorded a year ago.
Correspondingly, value added per establishment rose by 14.7 per cent to
$212,200 in 2005. |
|
II. MAIN RETAIL ACTIVITIES |
|
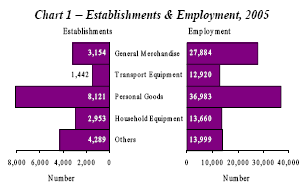
Firms engaged in retailing of personal
goods sector constituted the largest sector in the retail trade
industry, accounting for 40.7 per cent of the total retail
establishments (Chart 1). The sector engaged about 37,000 workers,
accounting for 35.1 per cent of the total retail workforce in
2005. |
|
 |
|
On a per establishment basis, the
sectors of general merchandise and transport equipment were the
largest employers, employing an average of 9 workers per
establishment in 2005. It was higher than the average employment
size of 5 workers per establishment in other sectors. |
|
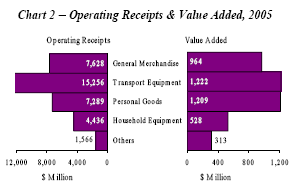
Retailers of transport equipment
generated $15.3 billion operating receipts in 2005, contributing
about 42.2 per cent of the industry total (Chart 2). Driven by
increasing motor vehicle sales, the sector registered higher
turnover of 11.6 per cent over the previous year. |
|
The sectors of transport equipment and
personal goods were the top two contributors to retail value
added, generating $1.2 billion value added respectively in 2005.
Together, they accounted for 57.4 per cent of retail value added. |
|
 |
|
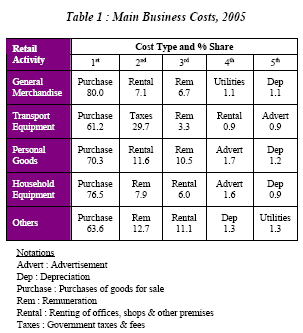
Purchase of goods for sale was the top
cost item, accounting for between 60 to 80 per cent of the total
operating expenditure for various retail sectors (Table 1).
Remuneration and rental constituted the next two largest
expenditure items for most retail sectors, except transport
equipment sector. Government taxes & fees formed the second
largest expenditure item for retailers of transport equipment. |
|
 |
|
III. KEY PERFORMANCE RATIOS |
|
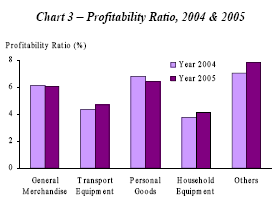
Profitability Ratio
of the overall retail trade was 5.4 per cent in 2005, similar to the
5.3 per cent attained in the previous year. Among the retail
sectors, retailers of personal goods recorded the highest
profitability ratio at 6.4 per cent, followed closely by retailers
of general merchandise at 6.1 per cent (Chart 3). |
|
 |
|
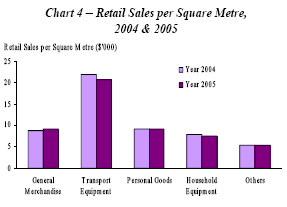
Retail Sales per Square Metre
of Floor Area remained at $10,500 per
square metre for the overall retail trade industry in 2005.
Retailers of transport equipment generated the highest retail sales
per square metre at $20,700, followed by retailers of general
merchandise at $9,200 (Chart 4). |
|
 |
|
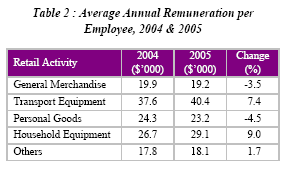
Average Annual Remuneration per
Employee increased by 1.7 per cent to
$24,600 for overall retail trade in 2005. Average remuneration was
highest for employees in the transport equipment sector at $40,400
in 2005 (Table 2). Employees in the household equipment sector saw
the largest wage increase in 2005, growing by 9.0 per cent from an
average of $26,700 in 2004 to $29,100 in 2005 (Table 2). |
|
 |
|
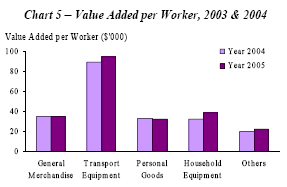
Value Added per Worker
amounted to $40,200 for the overall retail trade industry in 2005,
representing an increase of 5.2 per cent compared to 2004. The
transport equipment retailers recorded the highest level of value
added per worker at $94,600 in 2005, compared to $22,300 to $38,600
in other sectors (Chart 5). |
|
 |
|
IV. PERFORMANCE BY FIRM SIZE |
|
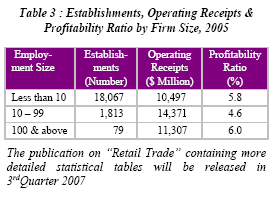
The majority (90.5 per cent) of firms in
retail trade were small firms (i.e. less than 10 workers), while
medium firms (i.e. 10-99 workers) contributed the largest share
(39.7 per cent) of the operating receipts (Table 3). On the other
hand, large firms (i.e. 100 workers & above) attained the highest
profitability ratio of 6.0 per cent. |
|
 |
|
More..... |
|
Source:
www.singstat.gov.sg Media
Release 18 May 2007 |
|
 |
|
Important
Notice |
|
Our FrontPage
Editions are a historical record of our Web site and reflect
the changing of the times, and also of our Web site through
time. We do not and will not update the links and stories on
these FrontPages even if they have become obsolete. |
|