|
 |
|
Source:
www.singstat.gov.sg
|
|
ECONOMIC SURVEYS SERIES
Reference Year 2006 |
|
Transport and Storage Services |
|
|
The transport & storage services industry
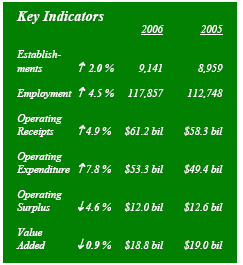
comprised 9,100 establishments in 2006. The industry employed a total of
117,900 workers, or an average of 13 workers per establishment. |
|
I. ECONOMIC PERFORMANCE |
|
Total operating receipts
generated by the transport & storage services industry was $61.2 billion
in 2006, a growth of 4.9 per cent over 2005. |
|
The increase in 2006 was smaller compared
with the double-digit growth of 17.0 per cent registered in 2005 when
the strong growth in the water transport sector boosted the overall
transport & storage services industry. On a per establishment basis,
operating receipts increased by 2.8 per cent in 2006 over 2005. |
|
Total operating expenditure
incurred went up by 7.8 per cent from $49.4 billion in 2005 to $53.3
billion in 2006. Correspondingly, operating expenditure per
establishment increased by 5.7 per cent to $5.8 million in 2006. |
|
Total operating surplus
dropped by 4.6 per cent from $12.6 billion in 2005 to $12.0 billion in
2006. On a per establishment basis, operating surplus decreased by 6.5
per cent to $1.3 million in 2006. |
|
Total value added
generated was $18.8 billion in 2006, 0.9 per cent lower compared to the
previous year. The drop was mainly due to a lower value added registered
by the water transport services in 2006 particularly shipping lines and
ship & boat leasing firms. On a per establishment basis, value added
dropped by 2.9 per cent to $2.1 million in 2006. |
|
II. MAIN ACTIVITIES IN TRANSPORT &
STORAGE SERVICES |
|
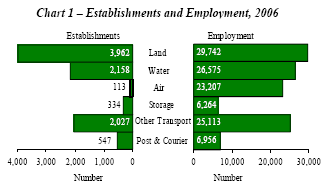
Land[1] transport firms which made up 43.3
per cent of total establishments in transport & storage services,
accounted for the largest share of 25.2 per cent of the industry’s total
workforce in 2006 (Chart 1). |
|
 |
|
On a per establishment basis, however,
air[2] transport firms were the largest employer, hiring an average of
205 workers. In spite of the relatively smaller number of firms engaged
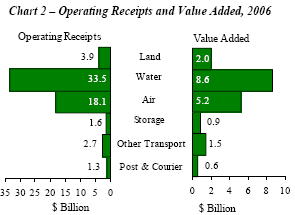
in water[3] and air transport services, they continued to account for
the largest share of transport & storage services’ total operating
receipts and value added at 84.3 per cent and 73.6 per cent respectively
(Chart 2). |
|
 |
|
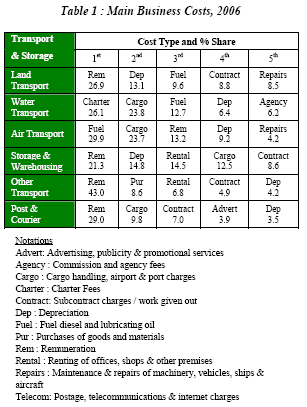
Except for firms in the water and air
transport services, remuneration was the top business cost item for the
other transport & storage services groups in 2006 (Table 1). |
|
 |
|
For water transport services, charter fees
on vessels and other transport equipment was the most significant
business cost item in 2006, constituting 26.1 per cent of the group’s
operating expenditure. For air transport services, the top business cost
item, fuel, accounted for more than one-quarter of the group’s operating
expenses. |
|
III. KEY PERFORMANCE RATIOS |
|
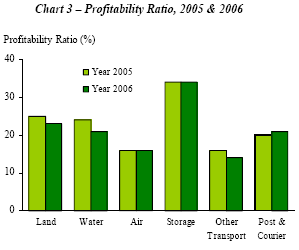
Profitability Ratio of the transport &
storage services industry dropped from 21.7 per cent in 2005 to 19.7 per
cent in 2006. Within the industry, firms engaged in water transport
services registered the largest drop from 24.3 per cent in 2005 to 20.9
per cent in 2006 (Chart 3). Firms engaged in storage & warehousing
services continued to have the highest profitability ratio of 34.0 per
cent in 2006. |
|
 |
|
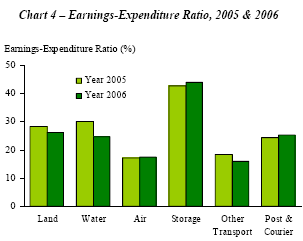
Earnings-expenditure Ratio remained the
highest for firms in storage & warehousing services, at 44.0 per cent in
2006 (Chart 4). While this group registered a higher earningsexpenditure
compared to 2005, the “water transport services” group recorded a drop
in their earnings-expenditure ratio in 2006. Due to a lower operating
surplus but higher operating expenditure, the water transport services
recorded a lower ratio at 24.8 per cent in 2006. |
|
 |
|
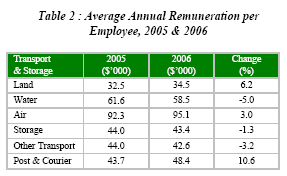
Average Annual Remuneration per Employee was
the highest for employees in air transport services. They received an
average annual remuneration of $95,100 in 2006, significantly higher
than the transport & storage services industry’s average of $55,500
(Table 2). |
|
 |
|
IV. PERFORMANCE BY FIRM SIZE |
|
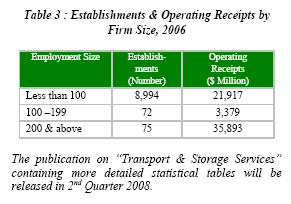
Firms with less than 100 workers formed the
majority (98.4 per cent) in the transport & storage services industry
(Table 3). However, firms with 200 workers & above, which constituted
only 0.8 per cent, contributed the most to total operating receipts
(58.7 per cent). |
|
 |
|
More..... |
|
1 Includes supporting services to land transport
2 Includes supporting services to air transport
3 Includes supporting services to water transport |
|
Source:
www.singstat.gov.sg Media
Release 4 Apr 2008 |
|
 |
|
Important
Notice |
|
Our FrontPage
Editions are a historical record of our Web site and reflect
the changing of the times, and also of our Web site through
time. We do not and will not update the links and stories on
these FrontPages even if they have become obsolete. |
|