|
Key indicators on Singapore's
Corporate Sector 1999-2003
Continued from
FrontPage
of Article
Main Table
Total Assets
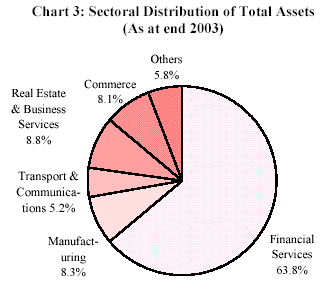
The financial services sector accounted for the bulk
of total assets (63.8 per cent or $1,644 billion) in the corporate
sector as at end of 2003. This was largely due to the significant
and highly liquid assets held by financial institutions in the
sector. Real estate & business services (8.8 per cent),
manufacturing (8.3 per cent) and commerce (8.1 per cent) were other
major sectors holding considerable assets. (Chart 3)
Of the total assets in the corporate sector, about
57.3 per cent or $1,476 billion were owned by foreign-controlled
enterprises More than half (55.9 per cent) of the assets held by
local-controlled enterprises were in financial services, followed by
real estate & business services (15.4 per cent) and transport &
communications (8.8 per cent). (Table 2)
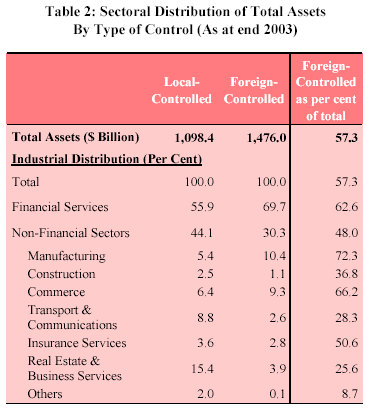
The financial services sector accounted for an even
higher share (69.7 per cent) of assets held by foreign-controlled
companies. Manufacturing and commerce accounted for 10.4 per cent
and 9.3 per cent of assets owned by foreign-controlled companies.
The foreign-controlled companies were particularly
predominant in manufacturing (72.3 per cent of assets in the sector)
and commerce (66.2 per cent).
Financial Structure of the Corporate Sector
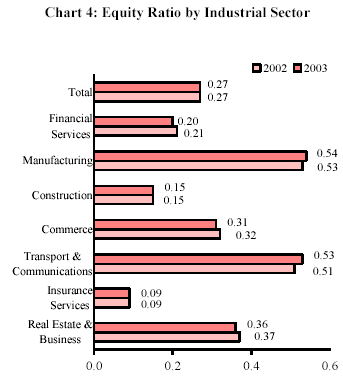
The equity ratio1 is a useful measure to analyse the
financial structure of the corporate sector. The equity ratio
measures the dependence of a company on external financing (funding
not from the shareholders, or its overseas head office for local
branches of foreign corporations). A company with a high equity
ratio depends less heavily on external financing than one with a
lower equity ratio. Equity ratio in the corporate sector was 0.27 at
end of 2003, unchanged from the ratio in 2002.
Among the sectors, insurance services (with equity
ratio of 0.09), construction (0.15) and financial services (0.20)
were most dependent on external financing. On the contrary, internal
funds constituted 54 per cent and 53 per cent of total assets in
manufacturing and commerce respectively. (Chart 4)
Overall, foreign-controlled companies recorded lower
equity ratio (0.21) compared with their local-controlled
counterparts (0.35). This was largely due to the comparatively lower
equity ratio registered by foreign-controlled companies in the
financial sector, arising from lower shareholders’ equity of
foreign-controlled companies in the sector. (Table 3)
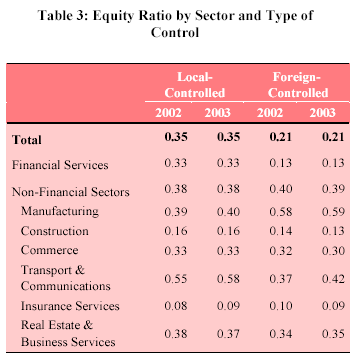
In comparison, local-controlled enterprises in
manufacturing were more dependent on external funds (0.40) than
their foreign-controlled counterparts (0.59). On the other hand,
equity ratio of local-controlled firms in transport & communications
(0.58) were significantly higher than that of foreign-controlled
ones in the sector (0.42).
The equity ratios of local- and foreign-controlled
companies were more comparable in sectors like construction,
commerce, insurance services and real estate & business services.
Performance of the Corporate Sector
Return on Total Assets (ROA)
The rate of return on total assets1 (ROA) is a
measure of the efficiency in the use of
resources that are available to the companies. The overall operating
efficiency in the corporate sector improved in 2003 as ROA reached
4.0 per cent, from 3.3 per cent in 2002. (Chart 5)
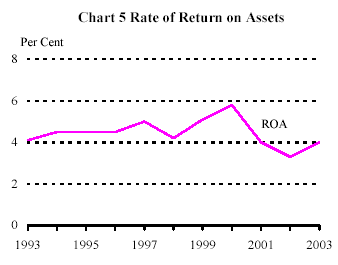
Over the past decade, ROA was generally between 3 to
5 per cent except in 2000 when it reached 5.8 per cent. Most sectors
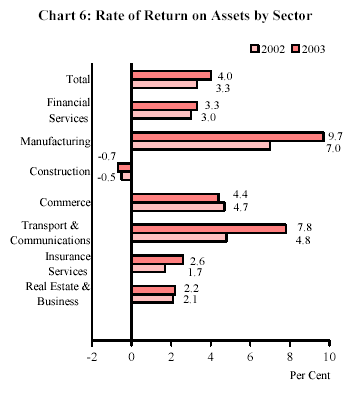
enjoyed an improvement in operating efficiency in 2003, particularly
in manufacturing and transport & communications. ROA in
manufacturing rose from 7.0 per cent in 2002 to 9.7 per cent in
2003, while ROA in transport & communications increased from 4.8 per
cent to 7.8 per cent during the same period.
ROA of companies in financial services also edged up
slightly from 3.0 per cent to 3.3 per cent. Among the sectors, the
companies in manufacturing registered the highest ROA of 9.7 per
cent. (Chart 6)
The improved operating efficiency in the corporate
sector was mainly due to the improvement in efficiency among
local-controlled companies. ROA of local-controlled companies rose
from 2.6 per cent to 4.1 per cent in 2003 while that of their
foreign-controlled counterparts remained unchanged at 3.9 per cent.
(Table 4)
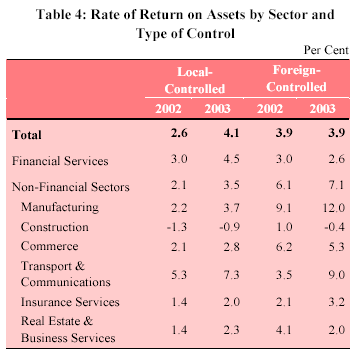
Despite the improvement in operational efficiency
among local-controlled companies across major sectors, they
continued to lag behind their foreigncontrolled counterparts in most
major sectors, except financial services and real estate & business
services.
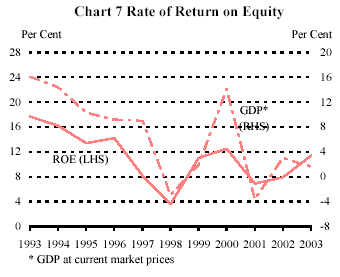
Return on Total Equity (ROE)
The rate of return on total equity1 (ROE) measures
the profitability of shareholders’ investment in the companies.
Overall the corporate sector was more profitable in 2003 compared to
2002, as ROE improved from 7.9 per cent to 11.4 per cent (Chart 7).
Generally, the profitability of the corporate sector was closely
linked to economic performance.
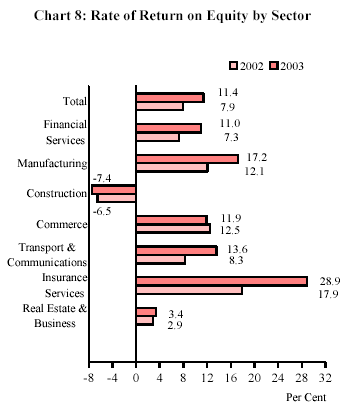
Most sectors experienced higher profitability in
2003. ROE in financial services increased to 11.0 per cent in 2003
from 7.3 per cent a year ago while return in manufacturing rose from
12.1 per cent to 17.2 per cent during the same period.
Transport & communications, insurance services and
real estate & business services were other sectors which enjoyed
improved profitability in 2003. ROE in commerce sector moderated
from 12.5 per cent in 2002 to 11.9 per cent in 2003. Insurance
services registered the highest ROE of 28.9 per cent. (Chart 8)
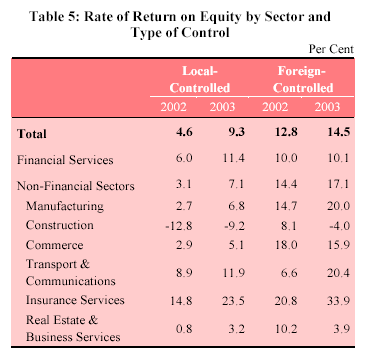
Although ROE of local-controlled companies doubled
from 4.6 per cent to 9.3 per cent in 2003, it continued to lag
behind that registered by foreign-controlled enterprises (14.5 per
cent). Foreign-controlled companies reported higher ROE than their
local-controlled counterparts in nearly all the major sectors except
in the financial sector where local-controlled companies registered
better return (11.4 per cent) than foreign-controlled ones (10.1 per
cent). (Table 5)
TECHNICAL NOTE
Objective
The data presented in this report were compiled from
the results of the Survey of Financial Structure and Operations of
Companies conducted annually by the Department of Statistics.
The data are used by policy makers, researchers,
business community and other interested users to analyze the
financial structure and performance of the various sectors in the
economy.
Legal Authority
The survey was conducted under the Statistics Act
(Chapter 317), which made the submission of returns mandatory. The
Act also stipulated that the contents of individual returns received
would be kept confidential and used only for statistical purposes.
Scope and Coverage
The survey covered companies incorporated or
registered in Singapore, including branches of foreign companies.
Partnerships and sole proprietorships are not included because of
the difficulty in obtaining information on paid-up capital and
reserves for such business enterprises.
Sample Selection
The sampling frame was based on the list of ‘live’
establishments obtained from the Department’s Commercial
Establishment Information System (CEIS). Information in the CEIS is
regularly updated through simple postal surveys of newly registered
companies, businesses and societies, and through extracting relevant
information from administrative and other sources such as the
Accounting and Corporate Regulatory Authority, newspaper
advertisements, Registry of Societies, various business and trade
associations and business and telephone directories.
The sampling method for the survey was based on
systematic stratified sampling. All establishments in the sampling
frame were stratified by company asset size, country of major
investor and economic activity. Establishments with large asset were
selected with certainty from stratum with pre-determined asset value
(take-all stratum). From the remaining smaller establishments, firms
were selected systematically in each stratum (take-some stratum).
The sample size was optimized with an appropriate
cut-off value (i.e. the value that delineates the boundary of the
take-all and take-some strata) based on the required precision
expected from the overall sample. This would ensure an optimal
sample size so as to achieve a reasonable accuracy of the survey
results.
The following categories of companies were however
covered:
(a) branches of foreign companies; and
(b) financial institutions.
Methodology
Data Collection
For companies which had up-to-date accounts posted
on their web sites (mostly public listed companies) or filed with
the Accounting and Corporate Regulatory Authority (ACRA), the data
were extracted from those accounts. Letters of requisition were sent
to the remaining companies requesting them to provide their company
financial accounts.
Reminder letters were sent to those companies which
failed to respond without reasonable explanations. A second reminder
was sent to companies which did not respond to the first reminder.
Queries or clarification with respondents on omissions and
inconsistencies were conducted through telephone or correspondence.
Relevant data were extracted from both the balance
sheet and income statement of the financial accounts of surveyed
companies. For accounts which are compiled using another currency
denomination, they are converted to Singapore dollars.
Data Processing
The Department processed the company financial
accounts and completed survey returns received via mail or fax using
the conventional data entry method. All data of completed returns
were manually scrutinised and edited before they were coded and
processed by computer. The manually edited data were entered via
networked personal computers to a data server for processing. The
data were then computer-edited for code validity, completeness and
consistency in order to detect the less obvious errors and
inconsistencies that had escaped manual detection or had occurred
during the data entry phase. The erroneous data were amended and
re-processed. Tabulation was carried out only after all records had
passed the computer editing.
Enumeration Unit
The enumeration or reporting unit used in the survey
was the "company" as defined under the Singapore Companies Act.
Branches of foreign companies which were registered under the
Companies Act were also included. Every company was treated as a
distinct and separate entity from its subsidiaries and only its own
accounts were analyzed. For companies which had set up branches, the
consolidated accounts of the company and its branches were used.
Year of Reference
The period of reference was the calendar year.
However, for establishments whose accounting year differed from the
calendar year, they were asked to report according to the accounting
or financial year covering the major part of the calendar year.
Type of Business Activity
Type of business activity referred to the principal
and secondary activities. The principal activity was defined as the
one in which the establishment devoted most of its resources or from
which it derived most of its income. Secondary activities were those
incidental or ancillary to the principal activity. The
classification of the type of activity of the establishment was
based on its principal activity and was in accordance with the
“Singapore Standard Industrial Classification, 2000”.
Definition of Terms
Local-controlled Companies
These are companies with at least 50 per cent of
their ordinary paid-up shares owned by shareholders whose
residential or registered address is in Singapore.
Foreign-controlled Companies
These are companies with more than 50 per cent of
their ordinary paid-up shares owned by shareholders whose
residential or registered address is outside Singapore. They include
branches of foreign corporations as well as subsidiaries of
foreign-controlled companies.
Assets
This refers to items that are of value which are
owned or being owed to the company. Examples include fixed assets
(e.g. buildings and equipment), investment in subsidiaries,
portfolio investment, cash deposits and trade credits due from
debtors.
Shareholders’ Equity
The paid-up share capital as well as the reserves of
a company are classified as shareholders’ equity. Paid-up capital is
the amount contributed by shareholders to the company and reserves
refer to the company's retained surpluses, revaluation gains, share
premiums and other reserve funds earmarked for contingencies,
improvements, etc. The amount is recorded in Singapore dollars at
nominal or book values.
Liabilities
Liabilities are amounts due to parties external
to the company. Examples include loans, bank overdraft and trade
credits due to creditors. The relationship between assets,
shareholders’ equity and liabilities can be expressed as follows:
Assets = Shareholders’ Equity + Liabilities
Total Equity
For Singapore branches of foreign banks, the value
of the net fixed assets of a branch is used as an approximation of
the amount of foreign capital invested in Singapore. For branches of
other kinds of foreign corporations, the net amount owing to the
head office is used.
Total equity comprises the amount of shareholders’
equity as well as net fixed assets (for branches of foreign banks)
and net amount due to head office (for other branches of foreign
corporations).
Equity Ratio
The equity ratio is defined as:
( Shareholders’ equity + net amount due to overseas
head offices ) ÷ Total assets
This ratio measures the dependence of companies on
external funding, i.e. funding not from their shareholders or their
overseas headquarters (for local branches of a foreign enterprises).
The lower the ratio, the higher is the company’s dependence on
external funding.
Current Ratio
The current ratio is defined as:
Current assets + amount due from holding and related
companies ÷ Current liabilities + amount due to holding and related
companies
This ratio measures the liquidity of companies, i.e.
their ability to meet current debt payments when due. Outstanding
balances in intercompany accounts with holding and other related
companies (but not accounts outstanding with overseas head offices
which are considered long-term and more akin to equity liabilities)
are included as current assets and liabilities in the calculation to
obtain a comprehensive measure of companies’ liquidity. A ratio of 1
indicates that the company has exactly balanced its current
liabilities with current assets. The further the ratio below 1, the
higher is the risk of the company running into a liquidity problem.
A ratio above 1 indicates an excess of liquidity in the company.
Rate of Return on Total Assets (ROA)
The rate of return on total assets is defined as
Pre-tax profits before deducting interest payments in the year ÷
Average of total assets at the beginning and end of the year
This ratio measures the efficiency of companies in
their use of assets to generate an operating surplus. Interest
payments are not deducted from earnings as they are the cost of
financing business capital rather than an operating cost. The
resulting ratio measures the earning capacity of the companies’
assets regardless of how the assets were financed.
Rate of Return on Total Equity (ROE)
The rate of return on total equity is defined as
Pre-tax net profits in the year ÷ Average of total equity at the
beginning and end of the year
This ratio measures companies’ profitability, i.e.
the rate of return that companies have earned on the capital
provided by the shareholders after accounting for payments to all
other providers of capital.
Both the ROA and ROE are computed on a pre-tax basis
as they provide a better measure of companies’ intrinsic efficiency
and profitability. It neutralizes the tax impact, which could be
different for different companies (e.g. certain companies may enjoy
tax holidays not enjoyed by their counterparts in the same business
activity).
Financial Leverage Ratio (FLR)
The financial leverage ratio is defined as
Average total assets at the beginning and end of the
year ÷ Average total equity at the beginning and end of the year
This ratio measures the proportion of total assets
over total equity. In other words, it is referring to the company’s
capital structure, which is determined by the company’s access to
capital from related companies and/or the international capital
market.
---------------------------------------------------------
1 The definitions and formulae for Equity
Ratio, Return on Asset (ROA) and Return on Equity (ROE) can be found
in the Technical Note.
Source:
www.gov.sg Media Release 20 Oct 2005
|


