|
 |
|
Source:
www.gov.sg |
|
ECONOMIC SURVEYS SERIES Reference Year 2004 |
|
HEALTH SERVICES |
|
|
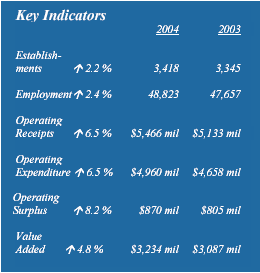
In 2004, the health services industry
comprised 3,400 establishments and employed a total of 48,800 workers.
This represented an average employment size of 14 workers per
establishment. |
|
I. ECONOMIC PERFORMANCE |
|
Total operating receipts generated by the
health services industry grew by 6.5 per cent to $5,466 million between
2003 and 2004. Correspondingly, on a per establishment basis, operating
receipts went up by 4.2 per cent to $1.6 million in 2004. |
|
Total operating expenditure incurred in 2004
was $4,960 million, an increase of 6.5 per cent over the previous year¡¯s
total of $4,658 million. On a per establishment basis, operating
expenditure rose by 4.2 per cent to $1.5 million in 2004. |
|
Total operating surplus increased from $805
million in 2003 to $870 million in 2004, an increase of 8.2 per cent.
Operating an increase of 8.2 per cent. Operating surplus per
establishment also increased by 5.8 per cent to $254,600 during the same
period. |
|
Total value added generated by the health
services industry was $3,234 million in 2004, an increase of 4.8 per
cent over 2003. On a per establishment basis, value added rose by 2.5
per cent to $946,200 in 2004. |
|
II. MAIN ACTIVITIES IN HEALTH SERVICES |
|
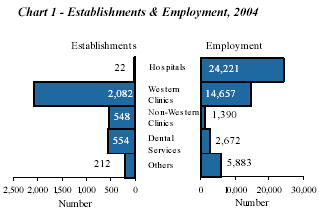
Western clinics1 formed a
significant 60.9 per cent of the total establishments in the
health services industry, employing 30.0 per cent of the total
workforce in the health industry (Chart 1). Although hospitals
accounted for the smallest share in terms of total establishments,
they were the largest employer, engaging some 24,200 workers in
2004, or an average employment size of 1,100 workers. |
|
 |
|
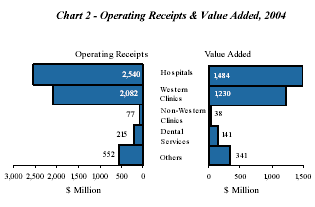
Hospitals were also the largest
contributors in terms of operating receipts and value added,
accounting for 46.5 per cent and 45.9 per cent of the respective
industry totals in 2004 (Chart 2). Western clinics constituted
another major group in the health services industry, accounting
for 38.1 per cent and 38.0 per cent of total operating receipts
and total value added respectively. |
|
 |
|
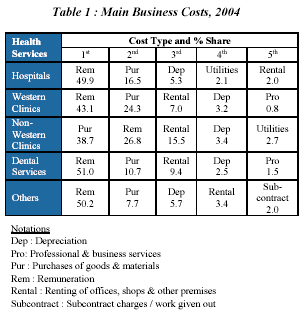
Remuneration made up nearly half of
the overall health services industry¡¯s total operating expenditure
in 2004. Except for non-western clinics, remuneration was the top
business cost item among the other health services groups,
accounting for 43-51 per cent of the respective group¡¯s total
operating expenditure (Table 1). |
|
 |
|
For nonwestern clinics, purchases of
goods & materials was the top business cost item, contributing
38.7 per cent of the group¡¯s total operating expenditure. |
|
III. KEY PERFORMANCE RATIOS |
|
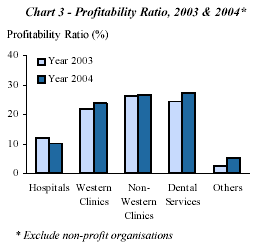
Profitability Ratio of overall health
services went up from 15.5 per cent in 2003 to 15.8 per cent in
2004. Within the industry, all health services groups recorded
higher profitability ratios except hospitals, which reported lower
operating surplus though operating receipts increased. Dental
services registered the highest profitability ratio of 27.4 per
cent in 2004 (Chart 3). |
|
 |
|
Cost Effectiveness, as measured by the
earnings-expenditure ratio, increased from 17.5 per cent in 2003
to 17.9 per cent in 2004 for overall health services industry.
Dental services, which recorded the highest ratio at 36.8 per
cent, was the most cost effective, followed by non-western clinics
(35.6 per cent) (Chart 4). |
|
 |
|
Average Annual Remuneration per
Employee was $50,100 for employees working in the health services
industry in 2004. Employees in western clinics continued to
receive the highest average remuneration of $53,600 (Table 2). |
|
 |
|
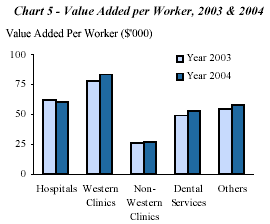
Value Added per Worker for overall
health services went up from $64,800 in 2003 to $66,200 in 2004.
Within the industry, western clinics continued to record the
highest average value added of $83,900 in 2004 (Chart 5). On the
other hand, nonwestern clinics¡¯ value added per worker was the
lowest at $27,300. |
|
 |
|
IV. PERFORMANCE BY FIRM SIZE |
|
Small firms (i.e. less than 10
workers) formed the majority (90.2 per cent) in the health
services industry in 2004 (Table 3). However, large firms (100
workers & above) which constituted only 1.1 per cent, contributed
the largest share of 60.2 per cent of the industry¡¯s total
operating receipts. |
|
 |
|
More..... |
|
1 Includes specialised
medical services. |
|
Source:
www.gov.sg Media Release 28 Apr 2006 |
|
 |
|
Important
Notice |
|
Our FrontPage
Editions are a historical record of our Web site and reflect
the changing of the times, and also of our Web site through
time. We do not and will not update the links and stories on
these FrontPages even if they have become obsolete. |
|